So, you have a dedicated business website, app or software that is serving customers or maybe you’re planning to develop one. Do you actually know the actions viewers are taking online? Are you taking support from a professional digital marketing services company?
Whether you run a brick-and-mortar store, eCommerce business, a restaurant, IT firm or any other business, knowing more about the people who visit your website and what they’re actually looking for can help you do wonders to improve online presence, attract audience, increase site engagement, and achieve lead conversion. With Google emphasizing user experience, it’s getting increasingly important to track user behavior on your website so that you can provide the right content and information your targeted audience is looking for.
There are diverse Google Analytics techniques that you can use to gain insights into user behavior. Google Analytics helps capture and understand user behavior in most kinds of applications, including mobile apps (iOS and Android), web and SaaS applications, and IoT (internet of things) devices.
What is User Behavior?
From the website UX perspective, user behavior refers to actions a website visitor takes – such as navigating to another page, scrolling down a page, clicking on certain links, staying long on a page or leaving at once when a page is loaded, and so on.
Behavior report is one among the important Google Analytics reports that can help businesses gain insights into user behavior. You can get a visual picture on the path a user follows from page to page or from event to event. You can not only measure user behavior, but also find insights about usage, and implement effective strategies that drive real change and improves the user experience and business performance.
By tracking user behavior, you can
- Gain a rich understanding of how people interact with your apps or pages on a website
- Discover the right content that keeps users engaged with your site
- Identify any potential content issues and correct them
- Know how people interact with your site and what obstacles impact their experience
- Know where readers eventually drop off the page and leave
- Measure important business actions that users complete, ecommerce transactions and purchases
- Find innovative ways to improve your visitors’ experiences, meet their needs and guide them toward conversion
Google Analytics behavior report can help track every user details and activity – ranging from the reader’s location, age, how they navigate through your website, the pages they visit, how long they stay, the actions they take, and much more. All such valuable data can be used to better optimize your website with more effective SEO strategies, content and more to attract more visitors.
So, how to access the Behavior report? Here are 3 key steps-
- Sign in to Google Analytics
- Navigate to your view and open Reports
- In the Reporting Tab, Navigate to Behavior
Behavior Report – What does it Include?
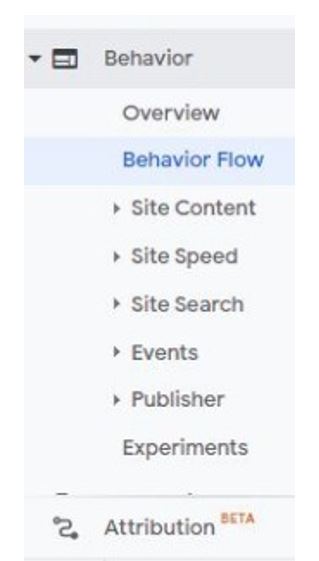
Google Analytics Behavior dashboard comprises the sections Overview, Behavior Flow, Site Content, Site Speed, Site Search, Events and Publisher.
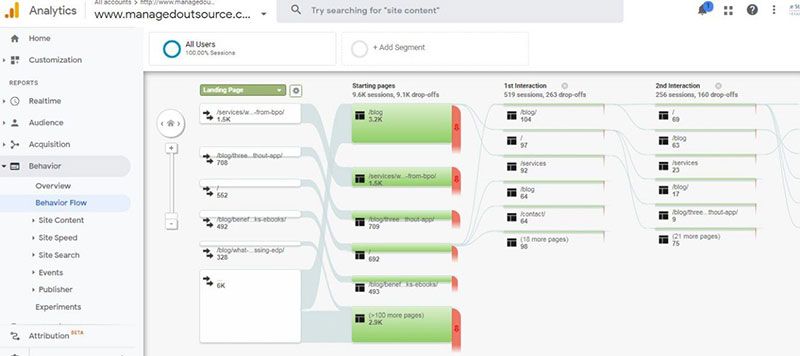
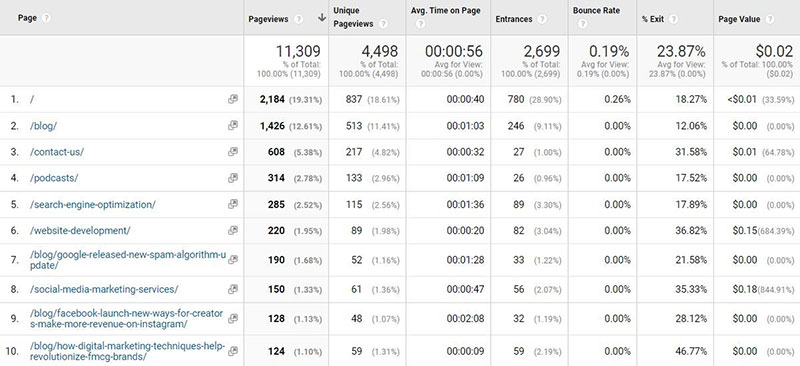
Check out the screenshots below that highlight our website’s Google Analytics Behavior report.
- Overview
This report provides an overview of user behavior and shows diverse metrics such as page views, bounce rates, average time on page, unique page views etc. to help you identify which pages need further optimization. You can focus either on individual pages or the entire website.
- Behavior FlowThe Behavior Flow report shows how viewers interact with various pages on your site. With this report, you can filter the content that is most engaging, the most common landing page, as well as the most popular exit pages.
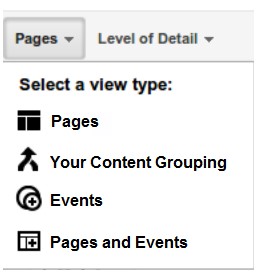
To use the Behavior Flow Report, use the view type selector at the top of the report to view the movement of users between Pages, Content Groupings, Events, or both Pages and Events.
- Types of Views You Can Choose From
https://support.google.com/analytics/answer/2785577?hl=en#zippy=%2Cin-this-article
- Content GroupingWith “content grouping” as the view type, the reports will show – how a user navigates, which groups are performing well, and which ones need improvement.
- Events“Events” view type highlights the user flow based on the events a user completed during the visit. You can gain insight into how a user responds to each event type and find the events which are more engaging to the user. To get this report, you must already have created events.
- Pages & EventsThese reports allow combining and differentiating the performance of events and pages.
The report displays nodes, connections and exits, which represent the flow of your traffic. Nodes are points through which traffic flows. A connection refers to the path from one node to the next and the volume of traffic that flows, and exit indicates where the user left the flow.
Never get confused between Behavior Flow and User Flow. They’re not the same. While the Behavior Flow report visualizes the path that a user follows from page to page or from event to event, user flow reports compare volumes of traffic from different sources to show which marketing channel is driving more traffic to your website.
- Types of Views You Can Choose From
- Site ContentThis report provides insight into how visitors engage and interact with various pages on your website.
Other report series in this section include:
- All Pages – provides information on which content performs best on your website based on factors such as traffic, unique page views, average time on page, bounce rate, exits and more.
- Content Drilldown: For websites with subfolders, this report helps to see the top folders of content, as well as the top content within each folder.
- Landing Pages: Here, you can get insights on the first-entry page that your visitors access and navigate throughout the website
- Exit Pages: With this report, you’ll get to know the last page people visit before leaving the website.
- Site SpeedTake a look at how your website performs in terms of speed and load time.
Metrics covered in this report include Average – page load time (in seconds), redirection time (takes a redirect before fetching a new page), domain lookup time (average time, spent in DNS or Domain Name System), server connection time (average time spent to establish a TCP or Transmission Control Protocol connection for a page), server response time (average time a server takes to respond to the request of the user) and page download time (average time to download a page on your website).
- Site Search
First, set up site search metrics for your website to use this report. You’ll get details such as who is using your website’s search box functionality, what terms were searched and on what page searches were conducted.
- Events
First, set up an event tracking code on your website and the report allows you to see the events with the most interaction.
- Pages report shows the top pages where viewers interact with events being tracked
- Events Flow report provides a path that viewers take on the website and interact with a specific event
- PublisherPublisher report provides details on PPC ads published using Google AdWords and the amount of income you receive from these ads.
Using This Analytics
Google recommends creating a measurement plan that defines your overall business objectives, strategies that support those objectives, key performance indicators (KPIs) to measure the success of the strategies, segmenting tactics to better understand what drives success, and targeting each KPI to understand if the business is reaching the goals set.
- Provide informative content to optimize user satisfaction
- Check out the exit pages and find ways to improve content so that visitors stay longer
- Make your landing page interesting and valuable enough for customers
- Combine scroll depth tracking with behavior flow to get more insights on user behavior
- Share links of related information of blog post on a page to encourage users to stay on your site and view another page
- Add a contextual link to further reading within the content
Before viewing this Behavior report, make sure to collect at least one- or two-weeks’ data in your Google Analytics.
Some other key features that Google recommends to measure user behavior are enhanced Ecommerce tracking, event tracking, custom dimensions and metrics.
With enhanced Ecommerce tracking, you can –
- measure the number of transactions, and the revenue that your website generates
- understand user behavior across the user’s entire online shopping experience
With event tracking, you can –
- analyze the user interactions from a web-page load or screen load
- understand how users share content with other users
Custom dimensions & metrics can help you to –
- collect and analyze data that Analytics doesn’t automatically collect
- combine Analytics data with non-Analytics data
- get deeper insights into user behavior
Have more questions regarding strategies to track user behavior? Give us a call at (800) 941-5527!
At MedResponsive, our SEO team uses all such valuable data to better optimize our client’s website and make sure their visitors are coming back.
If you’re not tracking Google Analytics report on your own, make sure to partner with an experienced search engine optimization company that can do it for you instead.


