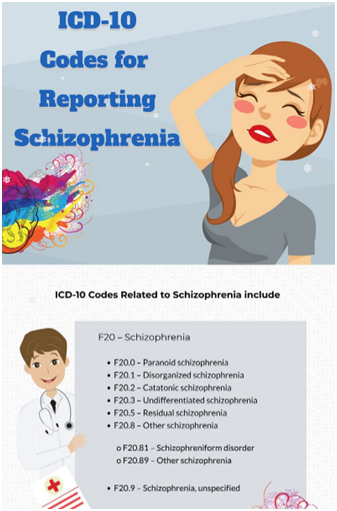
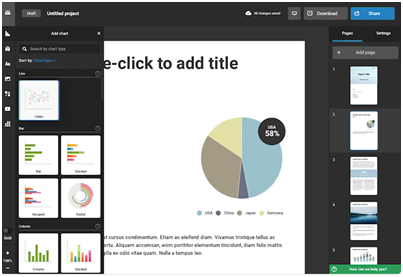
Infographics are one of the key digital marketing strategies now for any business to establish brand authority in their niche. An infographic can be defined as visualization of data to convey complex information that can be easily understood. With this story-telling tool, any information can be presented in a logical manner using data visualizations, text and pictures. Digital marketing in healthcare and other businesses focuses on infographics that are simple, clean, concise, and clear, ensuring that the information being conveyed is well-organized. It should be visually simple to make it easy for readers to comprehend.
The most popular types of infographics are based on
- Statistics
- Information
- Timeline
- Process
- Geography
- Comparison
- Hierarchical
- List
- Resume
Creating infographics could be a complicated and time-consuming process for business office staff. Several infographic creator tools are now available to design infographics with various templates available. Professional digital marketing agencies provide the services of skilled designers to create easy-to-understand infographics that can convert more visitors into customers with compelling visuals and data-driven results.
Role of infographic content in healthcare marketing
An infographic can provide data, numbers, statistics and similar information in healthcare in an attractive and structured way. The visual format adds to the positive impact the content createson target audience. Infographics can make information more appealing and even complex data can be communicated in an easy way.
Infographics can make healthcare content
- Compelling and attractive
- Easily viewable and shareable
- Engage the audience and be relevant for many audiences
- Have increased opportunity to be repeated over many sites
A study published in Science Direct suggests that infographics could play a role in summarizing medical research literature. Based on this report, infographics were also associated with higher reader preference and lower cognitive load during summary review.
Key platforms for infographic designers
Have an idea of these infographic creator tools
Piktochart
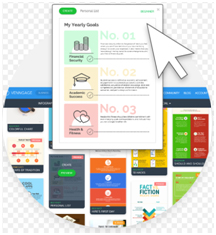
This cloud-based infographic solution is easy to use and provides simple graphics tools to build or edit infographics. Users can choose a template from a library of over 800 professionally designed infographic, presentation, and print templates.
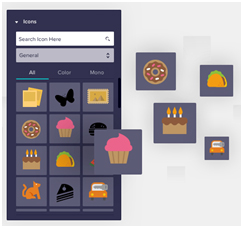
You can also choose from 1000s of free icons and images inside the infographics editor, or upload your own. There’s no concern about licensing fees, attribution or hassle. Using Piktochart, users can learn how to create an infographic and other visual projects in five minutes.
For the healthcare sector, Piktochart provides an easy way to communicate complex topics within the organization and also with health centers, to make sure everyone is in the loop. Based on the reports in Piktochart, 37,961 healthcare professionals use Piktochart to get better results. And 78% say that this platform helps communicate complex healthcare information more effectively. Clear designs can also help the public make informed health decisions.
Venngage
With this infographic maker, businesses and organizations can choose from more than a hundred infographic templates, charts, reports, flyers, brochures and social media images.
With the Business Plan you can choose from hundreds of professionally designed business and premium infographic templates. Save over 20 hours of design time with ready-to-use templates and create an unlimited amount of visualizations.
Choose from 100+ infographic templates on Venngage and follow these steps to create your own infographics.
You can create a beautiful infographic in just three steps –
- Choose one from the professionally designed infographic templates
- Add charts and visuals to visualize your data and information. You can also enhance the infographic by adding icons and images from the library.
- Finally customize the design by changing the fonts and colors with the infographic maker. Apply your own style to make your infographic unique.
Users can also share infographics and templates among members within their account to make communication and editing flow seamlessly.
Visme
With this tool, anyone can create professional shareable infographics in minutes, without any design experience. You can get stunning presentations or infographics right in your browser.
You can either choose an infographic template or use content blocks to quickly create custom designs from scratch. Then you can add charts, maps, video or audio to the design based on your unique requirement. After customizing, the infographic can be shared or downloaded in one click. You can publish it online or download for offline use.
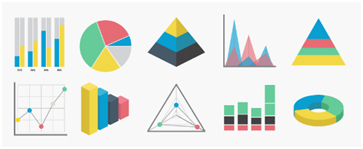
This tool comes with over 500,000 beautiful custom HD quality photos, a complete library of icons and graphics with editable colors and dynamic shapes and lines to complement any design. You can also select from over 20 beautiful charts and add diagrams, flowcharts and interactive maps based on the design.
Infogram
This easy-to-use infographic and chart maker helps create and share beautiful infographics, online reports, and interactive maps.
This intuitive visualization tool empowers people and teams to create attractive content. Visual storytelling with infographics can be easily done with Infogram.
Infogram’s drag-and-drop editor, interactive charts, and beautiful designs are guaranteed to set you up for success.
With this tool’s collection of infographic templates, users can quickly create historical timelines, step-by-step processes, how to guidelines, and data-centric infographics. These fully responsive infographics can be shared across all devices. You can also add them to Facebook Instant Articles, publish on Medium, or use Infogram WordPress plugin.
Healthcare entities or professionals can consider partnering with a medical website design company to get their website design and SEO goals efficiently met with effective infographics and other types of content.


